This is part one in a series of research reports on property crime in America.
The purpose of these reports are not to incite fear or "fear monger" in an attempt to convince people to purchase our products. In fact, many of our points will suggest the opposite. Video Surveillance certainly has a place in preventing or deterring crime, but our goal is to determine when and where these technologies are affective and appropriate. We will tackle some hotly debated questions: Does video surveillance affect crime rates and how? How are civil liberties and personal privacy affected by surveillance? Is video surveillance ever a bad thing? We'll also touch on topics surrounding surveillance and crime: Security cameras in the workplace, the rise of white collar crime, security cameras and terrorism, the prison industrial complex and it's affect on our industry.
The accompanying info-graphic details the statistics for common crimes in American cities across the nation. Where these crimes happen may surprise you.
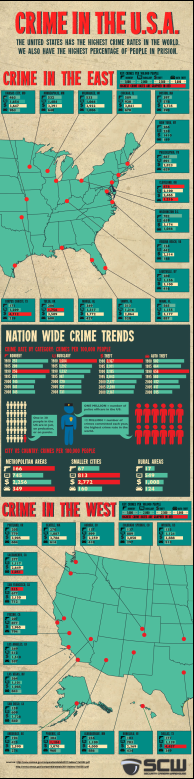
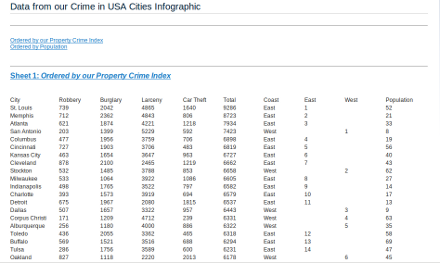 Table based Data from our Crime in USA Cities Infographic
Credits:
This Crime in the USA infographic was designed by Security Camera Warehouse.
Embed this Image on Your Site:

Crime in USA Cities by Security Camera Warehouse is licensed under a Creative Commons Attribution-NoDerivs 3.0 Unported License.
Defining the terms in our Crime in the USA Infographic
Robbery -- theft where the victim is present. Burglary -- unlawful entry of a structure (buildings, structures, boats, etc) to commit a crime. Auto Theft -- The stealing of a car or other vehicle. Theft -- stealing that is not included in the definitions of Robbery, Burglary, or Auto Theft (i.e. purse snatching, identity theft, forgery, con artistry, shoplifting) A good way to think about these stats is "You commit robbery on people, burglary at places, auto theft on cars, and regular theft is any other act of stealing."What cities made the cut?
We measured the property crime rates of the top 77 major cities US cities. We did not include violent crime, such as rape, murder, or assault but only property crime. While we have stated at the top that the US has the highest crime rate in the world, this encompasses all crime and only includes countries that actually track such data. For example, many countries in Africa would have higher crime rates if they were actually recorded, but the state of Civil War either prevents the statistics from being gathered or precludes them as acts of war. Our data tables include all US major cities (as defined by the US Census). This first infographic lists a geographically diverse selection of major US cities so that an idea as to the distribution of property crime can be established. We will also be publishing a this same infographic detailing the major cities with the highest crime rates and another reflecting the crime rates of America's larges cities.Crime in the USA Infographic Analysis
Crime In the East
The statistic that stands out the most is obviously that New York City's property crime rates are substantially low, but a study performed on data gathered from 2001 to 2006 from parts of Manhattan discovered no real yield as a result of surveillance. The integrated system was installed in 2004 allowing for the data to account for both time frames when these neighborhoods were under surveillance and before the system was installed. So, if New York City's impressive crime rates are not a result of surveillance then are these systems worth the cost and loss of privacy? The the opposite side of the spectrum is Orange, NJ, which has seen an almost 50% drop in crime rates since installing their extensive surveillance system. Some technologies employed here included mobile monitoring by police in the field, up-to-the-second police reports and listening devices around the city that would instantly report gun fire and it's location to the nearest officer. While Orange did see murders drop by over 50%, rapes down nearly a third, and robberies declined by half their neighboring cities saw extreme crime spikes. This is simply a case of crime deterrence to redirection, not crime prevention. It's much like how steering wheel locks works on your car. Sure it will discourage a would be car thief from stealing your car, but it's ineffective at preventing him from simply moving on to another car that doesn't have a steering wheel lock device. In the case of Orange, NJ the would be criminals simply chose to move their criminal activity to a less policed area. Second to NYC, Boston also stands out as a place with lower property crime than their public perception. Other surprises are that Corpus Christi, the big city known for it's small town feel, leads with the highest instance of theft. The locations of theft on our map was very interesting. Theft seems to occur in larger numbers wherever other crime went down. The major cities in the middle of the country, the great plains area, and the west had substantial amounts of theft. Although these areas may be know for having less crime, the truth is that the crime just apears to come in a different form and the criminals in the middle of the country appear to just be less confrontational about it.Crime In the West
Again completely opposite their perceptions as dangerous cities in the west, Las Vegas, San Diego, and Los Angeles all scored much better than their public perception. The number of robberies in the west was the highest in San Francisco. Phenonix has the highest rate of burglaries. And Dallas, Texas led the west in Theft.Why did we choose property crimes
We primarily chose property crimes as opposed to violent crimes, because of surveillance. Security Cameras can help prevent property crime, but often do very little to prevent crimes of passion or impulse. To be effective at deterring crime, surveillance cameras must be obvious and noticeable and the person committing the crime has to be a rational actor. A rational actor is someone who will act in their best interest. Someone who is not in their right mind because they on drugs or in a fit of rage is not a rational actor and will not be deterred by the presence of a security camera.Data used to create our Property Crime in the USA Infographic
Table based Data from our Crime in USA Cities Infographic
Embed this Data on Your Site: